Glances – the Best Modern Monitoring Tool for Linux
Overview:
This guide shows how to install and use Glances to collect and monitor operating system statistics in a Linux system.
Page Contents
What is Glances?
Glances is a free, open-source, modern, powerful, and cross-platform monitoring tool. Written in Python, Glances is designed and intended to present a maximum amount of information in a minimum of space, ideally to fit in a classical 80×24 terminal or higher to have additional information.
Glances shows a system’s CPU, uptime, load, memory, process list, network interface, disk I/O, filesystem (and directories/folders), IRQ/Raid, and sensors. It also supports warning/alert messages and monitoring of Docker or Podman containers.
Glances key features:
- It’s free, open-source, and cross-platform,
- It uses the psutil library to get information from the operating system,
- It’s configurable using a file in, INI format,
- Depending on the size of the terminal, it can adjust the displayed information dynamically,
- It can work in client/server mode: it includes an XML-RPC server and a RESTful JSON API which another client software can use,
- It ships with a built-in Web UI you can use to monitor your system from any device via a web browser,
- All system statistics Glances collects can be exported with this tool to CSV, InfluxDB, Cassandra, OpenTSDB, StatsD, ElasticSearch, or even RabbitMQ. It also offers a dedicated Grafana dashboard, and
- It supports the monitoring of Docker or Podman containers.
Install Glances on a Linux System
There are several ways to install glances on your Linux system. In the following sections, we will cover each option starting with the auto-install script.
Install Glances using the AutoInstall script
First, open a new terminal window. Run the following command to install Glances’ most recent production-ready version:
$ curl -L https://bit.ly/glances | /bin/bash
or
$ wget -O- https://bit.ly/glances | /bin/bash
Install Glances via PyPI
The next installation option is to use pip because Glances is on PyPI. This option also ensures that you have the latest stable version:
$ pip install glances
Install Glances via Default Package Manager
Glances is also available in the official repositories for mainstream Linux distributions such as Debian, Ubuntu, and Linux Mint. You can install it using the default package management tool like this:
#On Debian/Ubuntu/Linux Mint
$sudo apt update
$sudo apt install glances
On Enterprise Linux distributions such as Red Hat Enterprise Linux(RHEL), Rocky Linux, AlmaLinux, and related distributions, you need to enable the EPEL(Extra Packages for Enterprise Linux) repository before you can install it. Once you have EPEL enabled, use the yum or dnf package manager to install it like this:
#yum install glances
OR
#dnf install glances
Install Glances as a Snap
Additionally, Glances is available as a snap. To install it, ensure that you have snapd installed on your system. Then install Glances like this:
$sudo snap install glances
OR
#snap install glances
Using Glances in Linux
After installing Glances, simply run the glances command to launch it, like this:
$glances
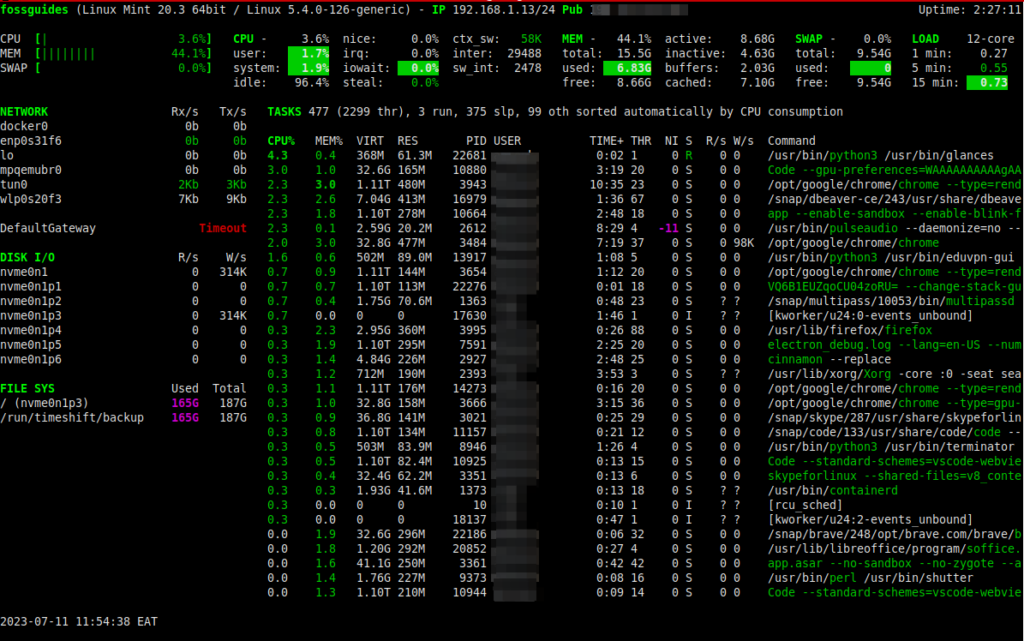
If the command runs successfully, you will view the Glances default interface as seen in the following screenshot. At the top section or header, it shows your systems hostname, distribution name and version, the kernel version, private and public IP address, and uptime.
The next section(Quick look)shows the CPU, RAM, and SWAP percentage usage and breakdown and system load.
The networks section shows network statistics which show the network Rx(received traffic) rate and Tx(transmitted traffic) rate on the different network interfaces enabled on your system.
The disk section shows disk I/O for all disk partitions on your storage disk and file system(disk partitions) used and available space.
The largest section shows a summary of a number of tasks sorted automatically by CPU consumption and the list of processes.
While Glances is running, you can use interactive commands(pressed keys) to modify its output. To view the list of these commands, click h.
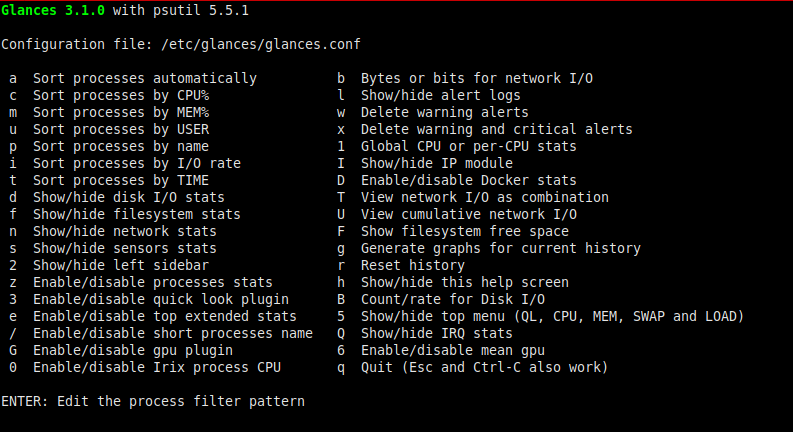
To exit Glances, press ‘q’ or ‘ESC’.
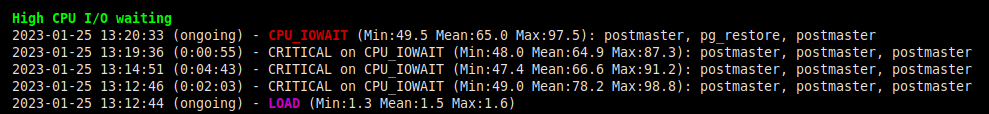
Glances Warning and Critical Alerts Section
Down below, if your system has any issues, Glances show will you warnings and/or critical alert messages as shown in the following screenshot.
Monitoring Containers Using Glances
If you are running containerized workloads using Docker or Podman on your system, Glances lets you monitor your containers as shown in the following screenshot. It makes use of the container API via the docker-py and podman-py libraries.

Display Raw Python Statistics Using Glances
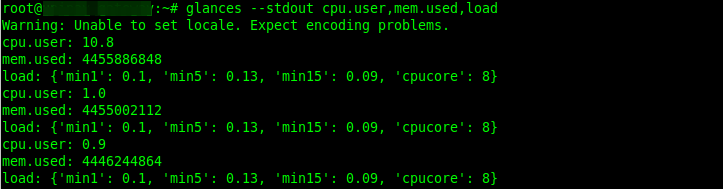
Glances also enables you to display RAW Python statistics. This example sends the RAW stats directly to stdout using the --stdout option:
#glances --stdout cpu.user,mem.used,load
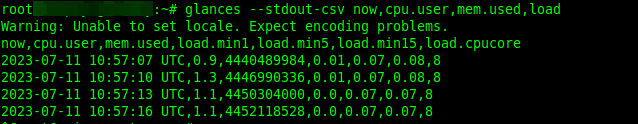
Glances also enables you to display RAW Python statistics in CSV format using the --stdout-csv option, like this:
#glances --stdout-csv now,cpu.user,mem.used,load
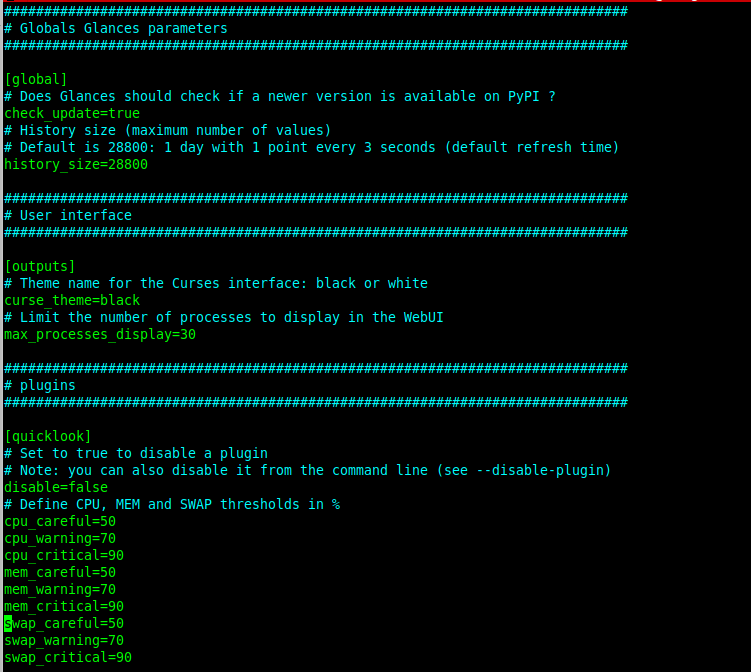
Configuring Glances Using a File
Up to this point, we have run Glances using the default parameters. As mentioned earlier, Glances is configurable, using a file, which by default is located at /etc/glances/glances.conf. Before you modify the default file, you can create a backup of it like this:
# cp /etc/glances/glances.conf /etc/glances/glances.conf.bk
Then use your favorite text editor to open the configuration file for editing, for example, using the vim editor:
#vim /etc/glances/glances.conf
Note: You can create your own glances.conf file and store it under the ~/.config/glances/ or /usr/share/docs/glances/ directory. Besides, user-specific options override system-wide options(stored in the default file) and command line options override either.
You can view more Glances command line options by viewing its man page like this:
# man glances
Conclusion
Glances is a modern, cross-platform, configurable, and powerful monitoring tool designed to provide as much information as possible through a curses interface or a web-based interface in as little space as possible. For any questions or comments about this post or Glances, use the comment form below.
For more information, visit the Glances project website: https://nicolargo.github.io/glances/